Posted on 2021-06-28
There’s not much information on how to use the Chart.js's legendCallback option to generate a custom legend, especially with React functional components/hooks. I had a lot of trouble figuring out how to do this and wanted to share what I learned.
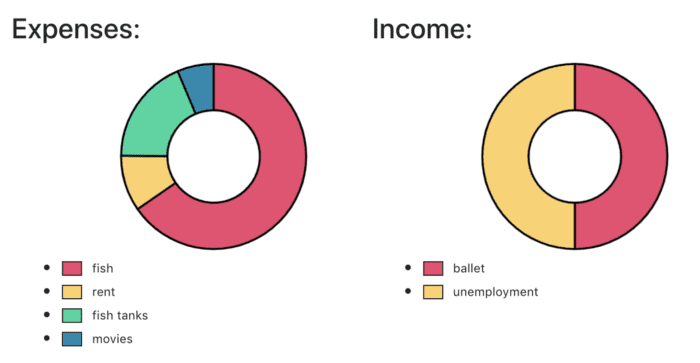
I needed to create a custom legend to address discrepancies in size between two side-by-side Doughnut charts with different amounts of data. The charts kept rendering with different sizes, and after some Google-ing I decided the best way to solve this would be to generate my own legends.
To make your own custom legend, you need to make sure that you don’t display the default legend, and then provide your chart with a callback function in its options object:
const options = {
  legend: {
    display: false,
  },
  legendCallback: () => {
    // your legend callback function here
  },
};
In my case, I wanted to create a simple legend that shows each of my labels next to the color block that represents it in the chart, so this is what the callback looks like:
legendCallback: (chartInstance) => {
  let labels = chartInstance.data.labels;
  let clrs = chartInstance.data.datasets[0].backgroundColor;
  let borderWidth = chartInstance.data.datasets[0].borderWidth;

  return (
    <ul className="chart-legend">
      {labels &&
        labels.map((label, index) => (
          <li
            onClick={(event) => handleLegendClick(event, index, chartInstance)}
          >
            <div
              className="legend-block"
              style={{
                backgroundColor: colors[index],
                border: `${borderWidth}px solid`,
              }}
            />
            {labels && <div className="legend-label">{labels[index]}</div>}
          </li>
        ))}
    </ul>
  );
};
I’m just using some classic JSX to iterate over my chart’s labels and create a <li> for each label with a color block and its corresponding text. I’m also giving each item an interactive click handler. So far so good!
The tricky part for me was the next step. Chart.js doesn’t automatically render this legend for you — you need to call generateLegend() on your chart instance in order for the legend to actually render in the DOM. So I needed to access the chart’s DOM node in order to call generateLegend(). My immediate thought (and probably yours too) was, “This sounds like a great use case for React’s useRef hook!”, and I was right, sort of.
Unfortunately, I found that the chart legend still wasn’t rendering 100% of the time. Eventually I realized that I had created a race condition where if the chart’s DOM node didn’t exist yet, the legend wouldn’t render. “Fine,” I thought, “I’ll just use React’s useEffect hook, use the chart’s ref as a dependency, and update the legend whenever the ref changes.” But I was foiled again. I soon found out that you can’t use a ref as a dependency for useEffect. Here’s an explanation of why not to use a ref as a dependency in a useEffect call, from the React docs: “…an object ref doesn’t notify us about changes to the current ref value.” So it follows that useEffect will never get called if we never get notified about changes to the ref value.
Instead, React recommends that you use a different hook — useCallback — to notify us whenever the ref changes. Now we can call generateLegend() inside of this callback. Then, instead of giving your chart instance’s 'ref' attribute a standard ref object created from useRef, we give it that callback we just defined. When the DOM node changes, it will call useCallback, our legend will be generated, and all will be well! Here’s what it looks like, and note that I’m using the useState hook as well in order to store state for the DOM node and our legend:
const [legend, setLegend] = useState();
const [ref, setRef] = useState();

const onRefChange = useCallback((node) => {
  // ref value changed to node
  setRef(node); // e.g. change ref state to trigger re-render
  if (node !== null) {
    setLegend(node.chartInstance.generateLegend());
  }
}, []);
And here is what rendering the Doughnut component inside a parent component will now look like, using that callback for its 'ref' attribute:
export const Parent = () => {

  // ...your parent component's contents

  return (
    <Doughnut date={chart} options={options} ref={onRefChange}>
  )
}
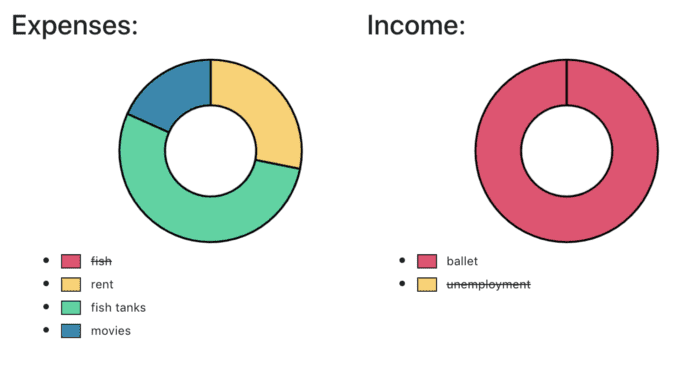
One last thing: I wanted my legend to be interactive, similar to Chart.js’s default legend. As I mentioned above, I passed a click handler to each <li> in my legend callback. The default Chart.js legend responds to clicks by crossing out the legend item and removing it from the chart, creating an interactive chart where the user can choose which data is being visualized. To replicate this behavior, I wrote the following click handler:
const handleLegendClick = (event, datasetIndex, chartInstance) => {
  let e = event.target;
  chartInstance.getDatasetMeta(0).data[datasetIndex].hidden =
    chartInstance.getDatasetMeta(0).data[datasetIndex].hidden ? false : true;
  e.classList.toggle("crossed-line");

  chartInstance.update();
};
I simply access the relevant index in the chart instance’s data and toggle it’s ‘hidden’ attribute and then toggle the element’s class name (I use CSS to cross out elements in the “crossed-line” class). Easy as pie (or…doughnuts, in this case? Sorry, I couldn’t help it). Here’s what it looks like!
And with some items crossed out:
I hope you enjoyed learning about custom legends in Chart.js! If you want to check out the repo for the project in which I implemented these charts, it’s available here.

